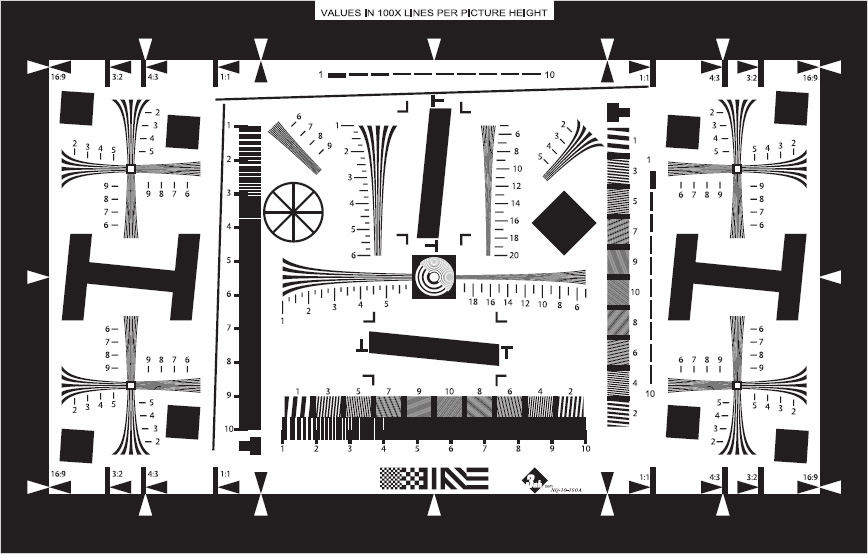
ISO 12233 RESOLUTION TEST CHART
2014-06-12
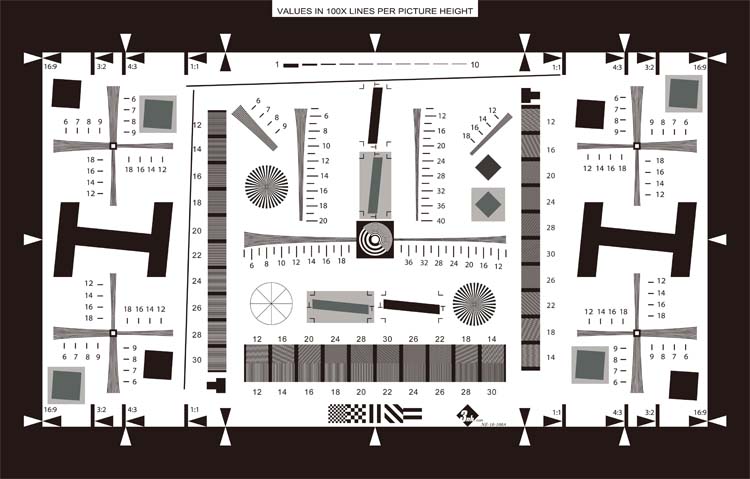
3nh chart is precise aid, designed for image quality determining and for judgment of resolution limits of digital cameras. The chart is designed for photographic cameras up to 2000 addressable pixels in picture high (cca 6Mpix camera). When testing cameras with higher resolution (up to 24Mpix cameras), place your camera to double distance from the chart. The test image will cover only 50% of active pixels in image high and concurrently multiply all values on the chart by two.
The chart is made in various versions (on Photographic Paperr, Chrome on Glass, Chrome on Opal,), in various contrasts (15:1 to 30 000:1)) and in various sizes (20x36 mm to 800x1422 mm).
For complete analytical test of your camera, we recommend you to shoot one more test image, composite of:
18% grey card (GC18) + color chart (BST4 or BST11) + grey step wedge (OW20).
THE CHART CONTAINS
· Black frame “F” and central focusing element “C” – for basic setup of the camera.
· Hyperbolic resolution elements “H” (6 elements in 3 directions in central part) and “H′” (4 composite patterns in corners) – for visual resolution determination (on monitor).
·Swept frequency wedges “S” – for limiting resolution and visual “sharpness” measurements (according to the loss of modulation at higher frequencies).
· Isolated lines “G” – useful to study quality of image details and software sharpening.
· Wheel “M” – for scanning linearity observations.
· Chessboard “N” – for compression artifacts study.
· Slanted lines “E” (bold lines with 1.5° inclination) – to judge stair stepping.
· Bursts “O” (horizontal and vertical belts with 5° inclined lines) – for aliasing ratio measurement.
· Other elements (L, T, T′) are used for SFR measurements. Special software is required for this application.
Application
Resolution test chart is the standard proof which can provide aided testing for vertical resolution and horizontal resolution of actual shooting.
Resolution test uses ISO 12233 resolution test chart and adopts unified shooting angle and environment.
The calculation of resolution test uses HYRes software, and the calculation will be done in two parts: vertical resolution and horizontal resolution.
Digital camera assessment is different from other products. It’s unlike laptop and DIY which have a lot of software to test objective data and everything can be seen from the data. However, assessing the quality of digital camera not only needs certain objective data, but also needs to combine actual operation and the shooting proofs. Therefore, our assessment is based on the principle of objective data and combined rational analysis from the experienced reviewers to obtain the most objective assessment results.
ISO 12233 resolution test chart is in accordance with ISO 12233 standard “Photography- Electronic Photographic Image-Measurement”. In active area of 1x size, the error is only 0.1mm when measuring the height of 20cm. It has almost all the characteristics of most resolution charts.
ISO12233 Resolution Chart 2000 lines
Enhanced ISO12233 Resolution Chart 4000 lines
SFR-Spatial Frequency Response
Amplitude response of camera and its dependence on relative input spatial frequency, called SFR (spatial frequency response). SFR is described by curve – dependence of measured amplitude on input spatial frequency. The curve is calculated from digital levels corresponding to “S” frequency wedges (see picture), using linearized ESF (edge spread function = signal progression on theoretical limiting sharp edge). Whole computation necessitates special software and skills. It is applied only in specialized laboratories.
